Operating Data
- New Segment
- Previous Segment
■1Q ■2Q(total) ■3Q(total) ■Full Year ●Full Year(%)
Digital Workplace Business Consolidated
Revenue & Operating Profit Ratio
Professional Print Business Consolidated Revenue &
Operating Profit Ratio
Industry Business Consolidated Revenue & Operating Profit Ratio
Imaging Solutions Business Consolidated Revenue & Operating Profit Ratio
Latest Term Business Composition

2021/3 | 2022/3 | 2023/3 | 2024/3 | 2025/3 | ||
Digital Workplace Business Consolidated Revenue (millions of yen) | Full Year | - | - | - | - | |
3rd Quarter (total) | - | - | - | 450,592 | 458,539 | |
2nd Quarter (total) | - | - | - | 294,507 | 307,640 | |
1st Quarter | - | - | - | 143,286 | 152,023 | |
Digital Workplace Business Operating Profit Ratio (%) | Full Year | - | - | - | - | |
3rd Quarter (total) | - | - | - | 4.4 | 3.4 | |
2nd Quarter (total) | - | - | - | 2.1 | 2.1 | |
1st Quarter | - | - | - | 1.9 | 3.0 | |
Professional Print Business Consolidated Revenue (millions of yen) | Full Year | - | - | - | - | |
3rd Quarter (total) | - | - | - | 189,703 | 207,574 | |
2nd Quarter (total) | - | - | - | 124,004 | 139,055 | |
1st Quarter | - | - | - | 60,196 | 67,645 | |
Professional Print Business Operating Profit Ratio (%) | Full Year | - | - | - | - | |
3rd Quarter (total) | - | - | - | 4.6 | 4.3 | |
2nd Quarter (total) | - | - | - | 3.0 | 3.5 | |
1st Quarter | - | - | - | 1.6 | 2.5 | |
Industry Business Consolidated Revenue (millions of yen) | Full Year | - | - | - | - | |
3rd Quarter (total) | - | - | - | 90,121 | 89,176 | |
2nd Quarter (total) | - | - | - | 61,696 | 60,433 | |
1st Quarter | - | - | - | 29,663 | 30,968 | |
Industry Business Profit Ratio (%) | Full Year | - | - | - | - | |
3rd Quarter (total) | - | - | - | 13.3 | - | |
2nd Quarter (total) | - | - | - | 12.3 | 11.9 | |
1st Quarter | - | - | 13.1 | 10.0 | ||
Imaging Solutions Business Consolidated Revenue (millions of yen) | Full Year | - | - | - | - | |
3rd Quarter (total) | - | - | - | 73,061 | 76,052 | |
2nd Quarter (total) | - | - | - | 48,500 | 50,427 | |
1st Quarter | - | - | - | 21,783 | 22,840 | |
Imaging Solutions Business Profit Ratio (%) | Full Year | - | - | - | - | |
3rd Quarter (total) | - | - | - | - | - | |
2nd Quarter (total) | - | - | - | - | - | |
1st Quarter | - | - | - | - | - |
Reportable segments were classified into three segments, namely “Digital Workplace Business,” “Professional Print Business,” “Healthcare Business,” and “Industry Business.” A change to this business segmentation has been made and starting from the first quarter of fiscal year ending 2025, segment information is presented for the four segments of “Digital Workplace Business,” “Professional Print Business,” “Industry Business,” and “Imaging Solutions Business.”
The Precision Medicine Business is classified as a discontinued operation from the nine months ended December 31, 2024. As a result, revenue, business contribution profit, operating profit, and profit before tax represent the amount of continuing operations excluding the discontinued operation. Profit for the period and profit attributable to owners of the Company represent the sum of continuing operations and the discontinued operation. In addition, the results for the fiscal year ended March 2024 include discontinued operations.
Overview by Segment
i. Digital Workplace Business
Revenue of the Digital Workplace Business was 458.5 billion yen (an increase of 1.8% year-on-year), business contribution profit was 30.0 billion yen (an increase of 47.0% year-on-year), and operating profit was 15.5 billion yen (a decrease of 20.8% year-on-year). Business contribution profit increased in line with the effects of global structural reforms in the office unit and the reduction of selling, general and administrative expenses by narrowing down the business areas of the DW-DX unit. Operating profit decreased due to one-time costs related to global structural reforms and ending production activities of Konica Minolta Business Technologies (WUXI) Co., Ltd., the manufacturing subsidiary in China.
Revenue of the office unit increased year-on-year. The sales volumes of A3 MFPs with color models, monochrome models, and all models turned out to be at 92%, 97%, and 94% year-on-year, respectively; however, the hardware revenue was on par with the same period last year, partly due to the contribution of foreign exchange rates. The non-hardware revenue, such as consumables and services, saw an overall increase, partly due to the contribution of foreign exchange rates. By region, revenue increased in Europe, the United States, and China.
In the DW-DX unit, which mainly offers, such as IT services, revenue increased year-on-year. The services to manage business content and operation processes, which the Company is focusing on, were robust in Europe. In-house developed services, such as interpretation services using AI, grew in Japan. Revenue of the managed IT services decreased as a result of narrowing down regions and business areas based on profitability.
ii. Professional Print Business
Revenue of the Professional Print Business was 207.5 billion yen (an increase of 9.4% year-on-year). With the increase in gross profit resulting from the rise in revenue, business contribution profit grew to 10.7 billion yen (an increase of 21.8% year-on-year). One-time expenses associated with the global structural reforms were recorded, and operating profit amounted to 8.8 billion yen (an increase of 0.9% year-on-year).
In the production print unit, revenue increased year-on-year. The sales volumes of color models, monochrome models, and all models reached 99%, 91%, and 97% year-on-year, respectively; however, sales of hardware saw a rise due to the impact of foreign exchange rates. A 124% year-on-year increase in sales volume of the Heavy Production Print (HPP) with the fastest print speeds, which the Group especially focuses on, contributed to this growth. As for the non-hardware, such as consumables and services, revenue also increased year-on-year. Regionally, the revenue of the non-hardware increased in the United States, China, and India, remained stable in Europe, and decreased in Japan.
In the industrial print unit, revenue increased year-on-year. In terms of hardware, sales volumes of label printing, textile printing, and embellishment printing decreased, however, sales volumes of inkjet digital press (AccurioJet KM-1e) increased, and overall revenue increased. Non-hardware experienced revenue growth across all areas, including inkjet digital printing, label printing, textile printing, and embellishment printing, driven by the rising demand for digital printing. Efforts are being made to improve profitability with the aim of achieving profitability at an early stage.
In the marketing services unit, revenue increased year-on-year. In the print procurement support business, sales performed well due to intensified promotion activities of major customers in Europe, the United States, and Asia. The revenue of on-demand printing in South Korea also increased.
iii. Industry Business
Revenue of the Industry Business was 89.1 billion yen (a decrease of 1.0% year-on-year). The revenue of inkjet (IJ) components increased, however, due to trial tests for increased production and the rise in new product development tests in the performance materials unit, the selling, general and administrative expenses increased, furthermore, due to the lower gross profit resulting from lower revenue in the sensing unit, the business contribution profit amounted to 10.7 billion yen (a decrease of 14.3% year-on-year). As mentioned above, the operating loss of the Industry Business amounted to 17.6 billion yen (compared to an operating profit of 11.9 billion yen in the same period last year) due to recognition of impairment losses of 28.2 billion yen in the sensing unit and the optical components unit.
Revenue in the sensing unit went down compared to the same period last year. Revenue of light source color measurement instruments decreased due to the slowdown of demand, affected by restrained capital investments in displays mainly by major customers as well as intensified competition for some applications. The sales from object color measurement instruments decreased in Europe and the United States, but sales remained steady, particularly in Asia, resulting in revenue that was on par with the same period last year. Revenue of measurement instruments applying hyperspectral imaging technology increased due to strong sales of mainstay products, especially for recycling applications. The measurement instruments for automotive visual inspections saw steady sales, mainly in Europe and the United States, resulting in an increase in revenue.
In the performance materials unit, revenue increased year-on-year. Revenue of TAC films for TV decreased due to the decrease in demand. Sales of SANUQI-VA for large-screen TVs increased due to the expansion of demand and increased adoption for customers. In addition, sales of thin films for IT devices decreased due to the stagnation of the panel market for IT devices. Surplus stock in supply chains of thin films for smartphones from the same period of the previous fiscal year is reducing, and the demand showed a recovery trend, resulting in a steady revenue.
In the IJ components unit, revenue increased year-on-year. In the printheads for sign graphics application area, which is the fundamental area, although sales in China slowed due to the impact of economic downturn, sales remained steady in Europe, the United States, South Korea, and India, resulting in an increase in revenue as a whole. In the printheads in growth areas, the Company’s proprietary high-gap ink ejection printheads launched in December 2024, have begun to be adopted by domestic and international customers, primarily for printing application on cardboard.
In the optical components unit, sales of pick-up lenses used in Blue-ray and similar devices decreased, resulting in a decrease in revenue compared to the same period last year. On the other hand, in the field of industrial applications, on which the Company focuses, revenue of products for semiconductor manufacturing equipment has increased due to a strong market, and the Company is promoting efforts to improve production capacity for future business expansion, such as enhancing lens processing technology for higher precision.
iv. Imaging Solutions Business
The Imaging Solutions Business recorded a revenue of 76.0 billion yen (an increase of 4.1% year-on-year). Business contribution profit of the imaging-IoT solutions unit and the visual solutions unit increased, however in the healthcare unit, business contribution profit decreased due to a decline in sales of digital radiography (DR) in Japan and X-ray film in China. As a result, the business contribution loss was 7.1 billion yen (compared to a business contribution loss of 6.4 billion yen in the same period of the previous fiscal year). Additionally, the operating loss amounted to 7.4 billion yen (compared to an operating loss of 8.2 billion yen in the same period of the previous fiscal year). The loss has decreased year-on-year due to the impairment loss recognized in the visual solutions unit in the previous period.
The healthcare unit saw an increase in revenue year-on-year, mainly due to the impact of foreign exchange rates. Revenue of DR saw growth primarily in the United States. Sales of the Dynamic Digital Radiography system, which the Company is focusing on, grew mainly in Asia and Europe. Sales of medical IT remained strong in Japan and the United States. On the other hand, the sales volume of DR in Japan and X-ray film in China decreased, leading to a decline in sales.
The imaging-IoT solutions unit recorded an increase in revenue year-on-year. Revenue of the monitoring camera solutions progressed steadily in Europe and the United States. In addition, sales of Force Security Solutions, LLC (headquartered in the United States), the system integrator acquired in 2023, continued to be strong.
The visual solutions unit saw an increase in revenue year-on-year. Customer traffic at the directly managed planetariums in the domestic business remained strong.
■1Q ■2Q(total) ■3Q(total) ■Full Year ●Full Year(%)
Digital Workplace Business Consolidated
Revenue & Operating Profit Ratio
Professional Print Business Consolidated Revenue &
Operating Profit Ratio
Healthcare Business Consolidated Revenue & Operating Profit Ratio
Industry Business Consolidated Revenue & Operating Profit Ratio
Latest Term Business Composition
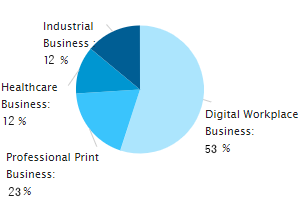
2020/3 | 2021/3 | 2022/3 | 2023/3 | 2024/3 | ||
Digital Workplace Business Consolidated Revenue (millions of yen) | Full Year | 549,021 | 465,212 | 465,421 | 600,279 | 614,928 |
3rd Quarter (total) | 413,623 | 336,267 | 333,721 | 437,140 | 450,592 | |
2nd Quarter (total) | 274,103 | 211,252 | 226,113 | 278,471 | 294,507 | |
1st Quarter | 94,580 | 121,172 | 128,912 | 143,286 | ||
Digital Workplace Business Operating Profit Ratio (%) | Full Year | - | - | - | 1.5 | 5.4 |
3rd Quarter (total) | 4.2 | - | - | 0.3 | 4.4 | |
2nd Quarter (total) | 4.8 | - | - | - | 3.4 | |
1st Quarter | - | 0.9 | - | 1.4 | ||
Professional Print Business Consolidated Revenue (millions of yen) | Full Year | 210,085 | 169,559 | 194,729 | 252,604 | 263,370 |
3rd Quarter (total) | 158,727 | 118,759 | 140,924 | 184,942 | 189,703 | |
2nd Quarter (total) | 103,298 | 73,454 | 93,515 | 119,853 | 124,004 | |
1st Quarter | 31,756 | 47,908 | 55,078 | 60,196 | ||
Professional Print Business Operating Profit Ratio (%) | Full Year | - | - | 0.5 | 6.6 | 4.4 |
3rd Quarter (total) | 3.2 | - | 0.4 | 6.1 | 4.6 | |
2nd Quarter (total) | 2.0 | - | 1.6 | 4.2 | 3.0 | |
1st Quarter | - | 2.0 | 1.7 | 1.6 | ||
Healthcare Business Consolidated Revenue (millions of yen) | Full Year | 118,516 | 109,095 | 109,930 | 137,841 | 138,997 |
3rd Quarter (total) | 85,562 | 73,599 | 84,380 | 96,899 | 98,545 | |
2nd Quarter (total) | 59,695 | 45,446 | 56,217 | 63,997 | 63,887 | |
1st Quarter | 20,527 | 25,220 | 28,652 | 29,340 | ||
Healthcare Business Operating Profit Ratio (%) | Full Year | - | - | - | - | - |
3rd Quarter (total) | - | - | - | - | - | |
2nd Quarter (total) | 5.6 | - | - | - | - | |
1st Quarter | - | - | - | - | ||
Industry Business Consolidated Revenue (millions of yen) | Full Year | 117,173 | 118,232 | 139,240 | 137,547 | 139,571 |
3rd Quarter (total) | 88,320 | 85,466 | 101,352 | 100,646 | 101,591 | |
2nd Quarter (total) | 59,856 | 53,950 | 68,585 | 67,453 | 69,357 | |
1st Quarter | 26,059 | 35,239 | 34,908 | 33,185 | ||
Industry Business Profit Ratio (%) | Full Year | 12.3 | 13.2 | 13.3 | 7.9 | 6.7 |
3rd Quarter (total) | 12.7 | 11.5 | 19.5 | 14.0 | 6.8 | |
2nd Quarter (total) | 11.6 | 9.4 | 21.1 | 15.9 | 8.0 | |
1st Quarter | 10.9 | 22.6 | 17.9 | 8.0 |
Reportable segments were classified into three segments, namely “Office Business,” “Professional Print Business,” “Healthcare Business,” and “Industrial Business.” A change to this business segmentation has been made and starting from the first quarter of fiscal year ending 2020, segment information is presented for the four segments of “Digital Workplace Business,” “Professional Print Business,” “Healthcare Business,” and “Industry Business.”
IR Newsletter

※Clicking the link above will take you to the“Mitsubishi UFJ Trust and Banking Corporation”website.
Most Viewed
- Financial Results / Presentation Materials FY2024
- Integrated Report (Annual Report) 2024
- Integrated Report (Annual Report)
- Financial Results / Presentation Materials FY2023
- IR Materials
Period : 01/03/2025 to 31/03/2025